
How Learning drives value: Kirkpatrick meets 4DX
So how do you know that your Learning and Development efforts are paying off?
I had a conversation with a Sales Operations team a while back, asking whether they saw any correlation between the sales training that was being required (and tied to comp!) and actual sales performance. They said they’d never been able to show even a correlation between learning and actual results.
So is sales training a complete waste of effort and resources?
This is the double-edged sword we swing as L & D professionals when we try making the business case for learning. Part of the problem is trying to correlate learning “completions” directly with sales bookings, deal size or other metrics that drive the business. It’s too large of a leap.
A possible solution is to break the problem down, and this is where The Four Disciplines of Execution (4DX) comes in. If you are not familiar with this book or methodology, you can check out a quick introduction by author Chris McChesney on YouTube.
The Second Discipline, the discipline of Leverage, tells us that for every Wildly Important Goal, there are “lead” activities that we control that can drive, influence or predict the “lag” results– those results beyond our direct control we only know about after they occur– like quarter sales numbers. By focusing on the “leads” (and measuring the leads and lags) we can clearly see our impact on the outcomes. This assumes, of course, that the lead activities actually determine, or at least predict, the lag results.
For the Learning professional, what are the leads and lags? And how do these translate to the leads and lags for our target audiences? By splitting Learning Leads and Lags from Performance Leads and Lags we get the following matrix, which maps nicely to Kirkpatrick’s Evaluation model:
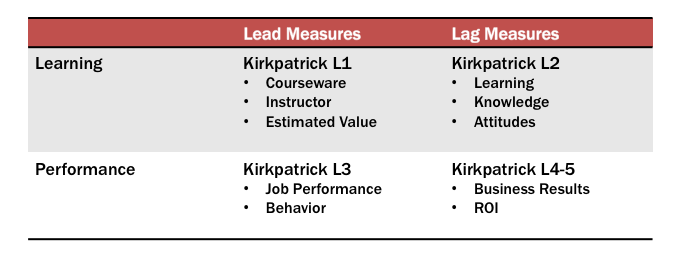
Working backwards from L4 in the lower right quadrant, we need to show that performance of the selected Lead measures (L3) actually drive, influence or predict the L4 business results. This is often the job of Sales Operations, using statistical correlation or regression analysis to show the connection.
We can use the same tools in the Learning row to show that L1 Evaluations of courseware quality, instructor prep and delivery and applicability of the content to actual job duties drives L2 Learning outcomes and improvement.
We only need to show that L2 drives, influences or predicts L3 performance lead metrics to indicate the value to the business. Our mistake has been trying to show a relationship between L1 and L4 directly without considering the intervening levels.
Performance is the key pivot point here: I’ll have more to say on the actual methods for determining these connections between Leads and Lags, and from Learning Lags to Performance Leads in future posts.
Recent Comments