Posts By D F
Cereal Killer App
Remember Sugar Bear? He was the coolest of the early 70s cartoon cereal ad mascots, way cooler than the Trix rabbit or the Fruit Loops toucan. At CISCO TAC Bootcamps we adopted him as our guru and I code-named this one project Super Sugar Crisp, mainly so I could hear serious network engineers refer to the thing by that name.
The Problem
in 2012 CISCO’s Technical Assistance Center (TAC) was a huge operation contributing to the Service and Support organization accounting for 1/3 of CISCO’s overall revenue. As with most call centers, support calls are initially handled by Level 1 engineers, and escalated to Level 2 if they aren’t able to resolve the issue. L2 escalations were carefully tracked and cost-accounted and at CISCO scale, any reduction in the number of escalations would have a huge bottom-line impact.
TAC engineers had access to a massive amount of support and training content, but it was distributed across a number of legacy sites managed by a variety of teams. This included support content like user and administrator guides, training content, data sheets, New Product Introduction (NPI) videos and presentations, release notes, software version lookups and more.
Finding the appropriate content in a timely manner while a customer was on the line was nearly impossible as all of these sites were organized for browsing rather than searching.
The Solution
Instead of trying to re-aggregate all this content under a single system, I designed and developed what amounted to a federated search engine tied to a metadata database with URL references to each content resource, document or file. Working primarily with Josh McCarty under Steve Roche and his boss John Rouleau, we scraped 15 or so source repositories and built the metadata database using MySQL. Metadata included summary description, URL, publish date, product and product family, version numbers, content type and more.
Then we built the back end application using an object-oriented, MVC-like model, with PHP Zend and PEAR frameworks and Zend Lucene as the search engine. Lucene is incredibly powerful for an easy-to-implement, open source search engine. We crawled the database and source repositories weekly to keep the data current.
The front end used the Domo javascript framework to display results (JQuery was just coming into fashion) as this allowed us to easily integrate into the CISCO intranet. We used a simple RESTful API and returned results in JSON format that was easily parsed into Domo widgets.
The Results
Within the first six months of deployment we found the system in widespread use by the TAC and L2 escalations being reduced in some areas by as much as 40%. Steve ran the numbers and found we were saving the overall TAC around $20M on an annualized basis. He submitted the project for a CISCO Pinnacle Award from Ana Pinczuk’s TAC organization under Joe Pinto, and we won in early 2013.


Does Sales Enablement require experience in sales?
In the spirit of transparency and candor, let me say that I have a definite opinion about this question and its answer. My view is based on my personal journey coming to Sales Enablement by way of training, learning and performance, data analytics and content management, rather than from a sales background.
That said, I’m not convinced that Sales Enablement can function fully without some sales “street cred.” In my previous role I collaborated very closely with a highly experienced and respected sales leader as a peer within an SE function. This sales expert was the “front of the house” – conducting onboarding quick starts, readiness bootcamps, peer- and manager-based assessment, and sales best practice calls.
However, that, of course, is not the whole story. If it were just about selling skills, Sales would already have all the knowledge necessary. Each sales organization is the world leader in expertise selling its solutions to its customers! The model of “sales-expert-instructor-led-training” is giving way to peer-to-peer coaching and review, knowledge sharing and team-based selling. This is an approach to the sales skills training aspect that I recommend when the SE function consists of a single SE practitioner.
And then we come to data, analytics, supporting infrastructure and technology, curriculum and certification program management and content governance– topics which probably make the eyes of most sales people roll into the back of their heads as they either keel over or run screaming from the room. These skills are found in practitioners at the opposite end of the behavioral spectrum- structured, detailed, analytical, programmatic, data-driven- from that of the archetypal account rep.
One issue here is the variance in definitions for Sales Enablement. I was gratified to find HubSpot defining Sales Enablement as data, technology and content– just where I fit in. But of course, that’s what HubSpot would want it to be.
The Sales Enablement Society has a more impartial and detailed working definition, which is result of a lot of collaborative work over the last year:
Sales Enablement ensures buyers are engaged at the right time and place by client-facing professionals who have the optimal competencies, together with the appropriate insights, messages, content and assets, to provide value and velocity throughout the buying journey. Using the right revenue and performance management technologies and practices, along with leveraging relevant cross-functional capabilities, Sales Enablement optimizes the selling motion and supporting processes in order to increase pipeline, move opportunities forward and win deals more effectively to drive profitable growth.
Note that this says very little about experience selling- it is mainly about the tools, processes and resources to support a complex sale mapped to the buyer’s journey.
So with all that, the question remains, and perhaps the answer is we need a hybrid approach that combines both in-field sales experience and credibility with the analytics, governance and management. This combination in one individual seems to me to be true “purple squirrel” territory, and effective sales enablement teams should perhaps be no smaller than two, and include at least one representative from both arenas.


Root Cause Analysis- Part 2
In the previous post, I compiled a long list of possible reasons why, in general, Sales Reps are not making their numbers.
Since we don’t have infinite time or resources, where should we focus our efforts to “move the needle” for sales? We can guess, from Pareto’s “80/20” rule, that there is a smaller number of items that have outsized impact on our results.
Fortunately, we have a number of tools to help us focus our improvement efforts. I’ll start with a few that I learned at my very first corporate job, as a file clerk at Chevron Pipeline Company, which, at the time, was pursuing a W. Edwards Deming-style quality improvement program.
In order to determine causation a number of factors need to be measured and analyzed. We’ve done the brainstorming of possible causes, and we can use a Cause-and-Effect or “Fishbone” diagram to try and understand the structure of causes.
Warning: In-the-weeds geek analysis ahead.
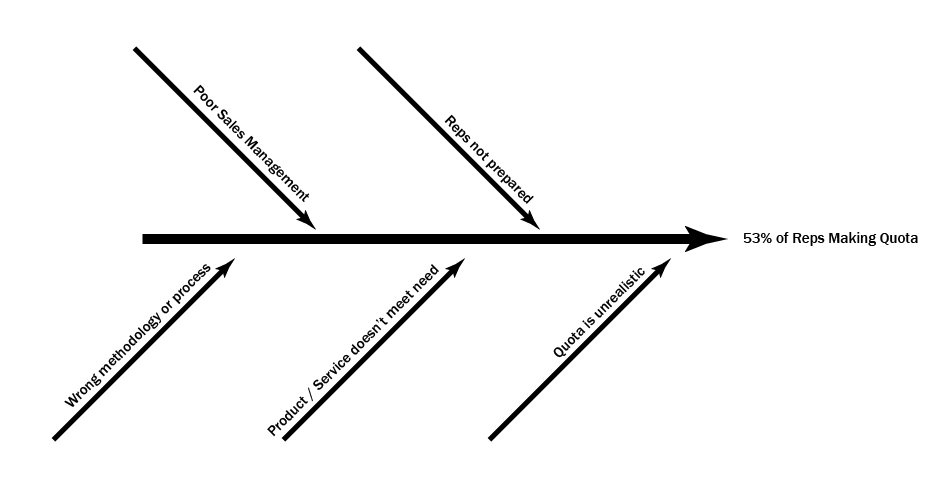
Start with a single horizontal line and arrow pointing to the effect.

Next we group the short list of possible causes into primary or direct causes, so.

The first thing to notice is that there are multiple primary or direct causes, all of which probably contribute (but not equally) to the effect. Second, we should be clear that this list may not be complete. Finally, some of the suggested causes may not be correct, or may be at the wrong level.
It’s important not to get caught too up in these details at this point- what we are doing is building a shared, testable model or hypothesis about what’s going on. Just know that there’s complexity here and we are probably missing some detail. “All models are false. Some are useful.”
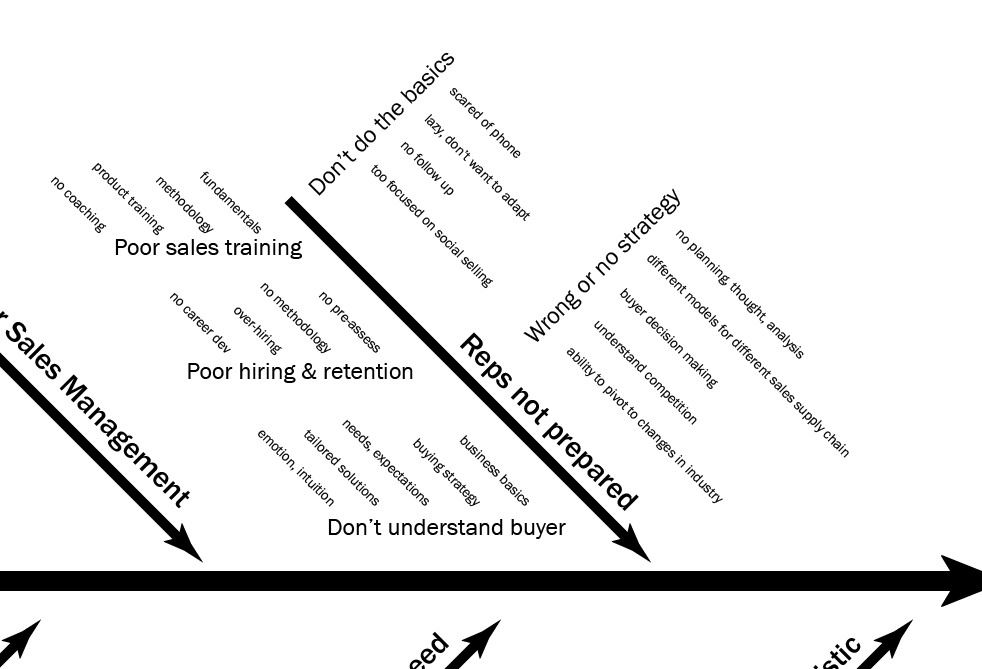
Next, let’s take one of these branches and break it down further. The “Reps not prepared” branch is usually where we look first, so I’ll take that one.

Now we’ve organized our branch into a set of 1 primary, 5 secondary (e.g. Poor sales training) and 22 tertiary (e.g. fundamentals) contributing factors.
Why go to all this effort?
Most importantly, I would say, is that this helps avoid the “jump-to-solution” issue. “More sales training!” “Different strategy!” “Fire the losers!”
Second, nearly as importantly, we capture our thinking about the problem space in a structured communication artifact.
Finally, we can design metrics and testing to validate hypotheses before taking action, spending time and money allocating resources to projects that may or may not pay off.
Root Causes of Sales Reps not meeting quota
I had an “aha!” moment a week or so ago reading through a thread on LinkedIn with a prompt: “Salespeople are getting worse.”
Why are only 53% of Account Execs (Reps) making quota? This stat comes from a CSO Insights report from Miller Heiman.
Reading through the extensive list of comments on the thread one finds many, many, MANY thoughts on what the problem might be.
- Lack of understanding about the Customer’s:
- business fundamentals
- buying strategy
- needs and desired outcomes
- service and support expectations
- need for tailored solutions
- emotional or intuitive buying responses
- Company
- unrealistic quotas, not based on benchmarks or historical data
- Rising quotas
- unhealthy growth expectations
- goals not based in reality
- goals inconsistent or not communicated
- Weak vision
- Scattered products
- No GTM strategy
- Poor culture
- Hiring / Retention
- no methodology
- no pre-assessment or vetting of candidates
- Over-hiring
- More reps fighting for same attention
- Career development
- Sales Training
- how to sell at the company- sales process
- Reps don’t want to adapt or learn
- Should cover planning, thoughtfulness, positioning, analysis of decision-making, competition
- Should include coaching and continuous learning
- Fundamentals for reps and leaders
- Ability to pivot on changes in industry
- Different models for sales supply chains
- Sales AND management training for managers
- Manager coaching training, both sales and management
- Product Training
- time, support and tools to understand product
- Effectiveness of product training
- Market and Environment
- Product offering meets actual need in the market
- Changes to demographics, technology, buyer behavior and expectations
- Digital disruption
- Empowered and informed buyers
- Sales Management
- VPs coaching DOSs coaching AEs
- Not open-minded to feedback or willing to change strategy
- Don’t know how to sell
- Obsessed with meaningless metrics
- “Blowtorch” management
- Sales Reps
- don’t want to work, marketing has made them lazy
- Scared of the phone
- Ability to challenge the buyer’s thinking
- Don’t do proper follow up
- Too focused on social selling
- Process
- Lots of gurus selling theory
- Picking the RIGHT process
- Funnel / pipeline problems
- Cycles have changed
- Need a holistic analysis of the process
- Need to automate the 64% of non-selling time
- Product
- doesn’t work, not viable
- pricing is wrong
- Sales Ops
- use data and data science to reassess strategy and improve
- Sales Ops identify trends not seen by Reps
- Stop seeing Sales Ops as overhead
- Doesn’t even exist in many orgs
That’s from ONE POST!
My question and “aha!” moment: who is analyzing all this to get to the 20% of these causing 80% of the gap? Which are Root Causes and which are Symptoms? Is anybody even doing correlation analysis (the first step) to see which of these might be root causes? I suspect there is a lot of guessing and tossing darts going on.
In a future post I’ll talk about some of the geeky details of how we answer these questions.
How Learning drives value: Kirkpatrick meets 4DX
So how do you know that your Learning and Development efforts are paying off?
I had a conversation with a Sales Operations team a while back, asking whether they saw any correlation between the sales training that was being required (and tied to comp!) and actual sales performance. They said they’d never been able to show even a correlation between learning and actual results.
So is sales training a complete waste of effort and resources?
This is the double-edged sword we swing as L & D professionals when we try making the business case for learning. Part of the problem is trying to correlate learning “completions” directly with sales bookings, deal size or other metrics that drive the business. It’s too large of a leap.
A possible solution is to break the problem down, and this is where The Four Disciplines of Execution (4DX) comes in. If you are not familiar with this book or methodology, you can check out a quick introduction by author Chris McChesney on YouTube.
The Second Discipline, the discipline of Leverage, tells us that for every Wildly Important Goal, there are “lead” activities that we control that can drive, influence or predict the “lag” results– those results beyond our direct control we only know about after they occur– like quarter sales numbers. By focusing on the “leads” (and measuring the leads and lags) we can clearly see our impact on the outcomes. This assumes, of course, that the lead activities actually determine, or at least predict, the lag results.
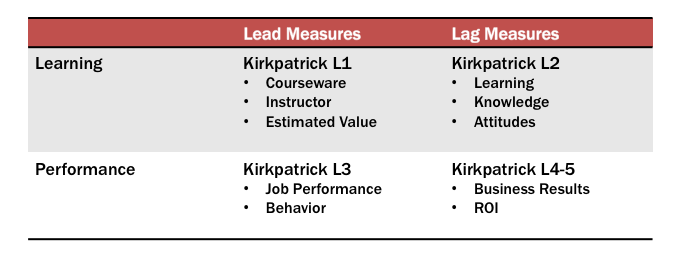
For the Learning professional, what are the leads and lags? And how do these translate to the leads and lags for our target audiences? By splitting Learning Leads and Lags from Performance Leads and Lags we get the following matrix, which maps nicely to Kirkpatrick’s Evaluation model:

Working backwards from L4 in the lower right quadrant, we need to show that performance of the selected Lead measures (L3) actually drive, influence or predict the L4 business results. This is often the job of Sales Operations, using statistical correlation or regression analysis to show the connection.
We can use the same tools in the Learning row to show that L1 Evaluations of courseware quality, instructor prep and delivery and applicability of the content to actual job duties drives L2 Learning outcomes and improvement.
We only need to show that L2 drives, influences or predicts L3 performance lead metrics to indicate the value to the business. Our mistake has been trying to show a relationship between L1 and L4 directly without considering the intervening levels.
Performance is the key pivot point here: I’ll have more to say on the actual methods for determining these connections between Leads and Lags, and from Learning Lags to Performance Leads in future posts.
15 questions to help guide Learning & Performance strategy
Over the last several years, as I’ve moved from individual contributor to manager and director-level roles, I’ve had to think more strategically about what learning and performance mean in the context of overall organizational growth. These ideas have been forged in the last five years in late-stage, high growth startups. In these companies, L & P strategy is often an afterthought, or “something that HR does.”
The following is a condensed list of my strategic planning questions:
- What would a 1% increase in Sales productivity (or customer retention) mean to your bottom line? 2%? 5%?
- Do you know whether your investment in learning is paying off? How do you (or would you) know?
- What’s the best way to invest your limited L & P budget?
- How do you measure the 90% of learning that happens outside formal e-Learning, virtual and classroom events?
- How are you embedding learning into individual work streams?
- Are you asking the right questions in your course evaluation surveys?
- What is the shelf-life of your e-Learning content? How are you updating and maintaining it?
- Do you have a learning content governance model? What is the value-add of quick access to accurate content?
- Do you have a job-role competency model? Is it used across recruitment, talent management, performance and learning systems?
- Which stages of ADDIE do you skip or gloss over?
- What are your top performers doing better, differently, more of or less of than average performers?
- Do you use proficiency levels and rubrics to guide both assessment and development of individuals?
- How is performance improvement built into your organization’s day to day work?
- How are you leveraging your learning resources for content marketing?
- How is your L & P strategy aligned with overall company goals and objectives?
- Is training part of your product development, go to market and commercialization planning?
In following posts I’ll tackle some of these questions in more depth, to get at the critical considerations for each and their relationship and cross-dependencies.

Recent Comments